


Accessing the Knowledge Center effectively requires a simple, one-time registration.
In part one of this how to series we explained how to identify target horsepower, why turbos are rated for crank horsepower, how to calculate wheel horsepower to crank horsepower depending on drivetrain. Horsepower and engine displacement are the two main inputs needed for selecting a turbo and will allow you to get a rough idea of what turbo is right for your build while the quick sort feature on the turbo product page can be used to eliminate non matches. You can always ask an authorized Garrett distributor or use our Boost Adviser application to help narrow your search results even further. In this article we look at Volumetric Efficiency, Brake Specific Fuel Consumption (BSFC), Engine Speed (RPM), Elevation, and we deep dive into the equations that are used to behind the scenes of Boost Adviser to match a turbo for your vehicle. Get your calculator ready because this may get complicated, but remember at any point you can click the Boost Adviser link above and it will take you to the automated system. Get ready to turbo any engine!
Calculating Pressure Ratio ( PR= P2c / P1c )
Pressure ratio is a variable equation that combines ambient pressure with gauge pressure divided by ambient pressure. This identifies where the compressor will perform its max duty cycle. Knowing pressure ratio is a key component to selecting the correct turbo for your application. PR is identified on the Y (vertical) axis of the compressor map. Additionally, pressure ratio is not an indicator of horsepower but we will get to that in another step.
P2c Absolute outlet pressure
P1c Absolute inlet pressure
- P2c= (PSIg + PSIa) Boost Gauge Pressure (PSIg) + Absolute Atmospheric Pressure (PSIa)
- P1c = (PSIa) Absolute Atmospheric Pressure (PSIa) – 1 System Depression
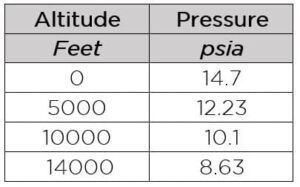
PSIg refers to gauge pressure and measures the pressure above atmospheric. A boost gauge pressure reading of 12 means the pressure in the manifold is 12 psi above atmospheric pressure. Depending on the build of the engine, your gauge pressure limits will vary. Stock engines usually have lower ability to handle boost, while highly modified engines can handle much more. Having a boost target is necessary for determining pressure ratio. PSIa refers to absolute atmospheric pressure. This is standard atmospheric pressure at standard conditions. If you are not at sea level you can substitute a value from the chart below for PSIa.
System Depression: An air filter or a restrictive ducting system will often result in LESS than the ambient pressure, especially at higher RPMs. This is because the air filter or ducting adds resistance to the air flow resulting in a pressure loss. Also known as depression, this can result in -1PSIg or more in some intake systems. We only make the depression adjustment to the (P1c) part of the equation because P1c is Absolute Inlet Pressure.
- Our Example: PR= P2c / P1c
- P2c (12 gauge + 14.7 atmosphere) / P1c (14.7 atmosphere – 1 depression)
- (26.7 / 13.7) = 1.95 Pressure Ratio
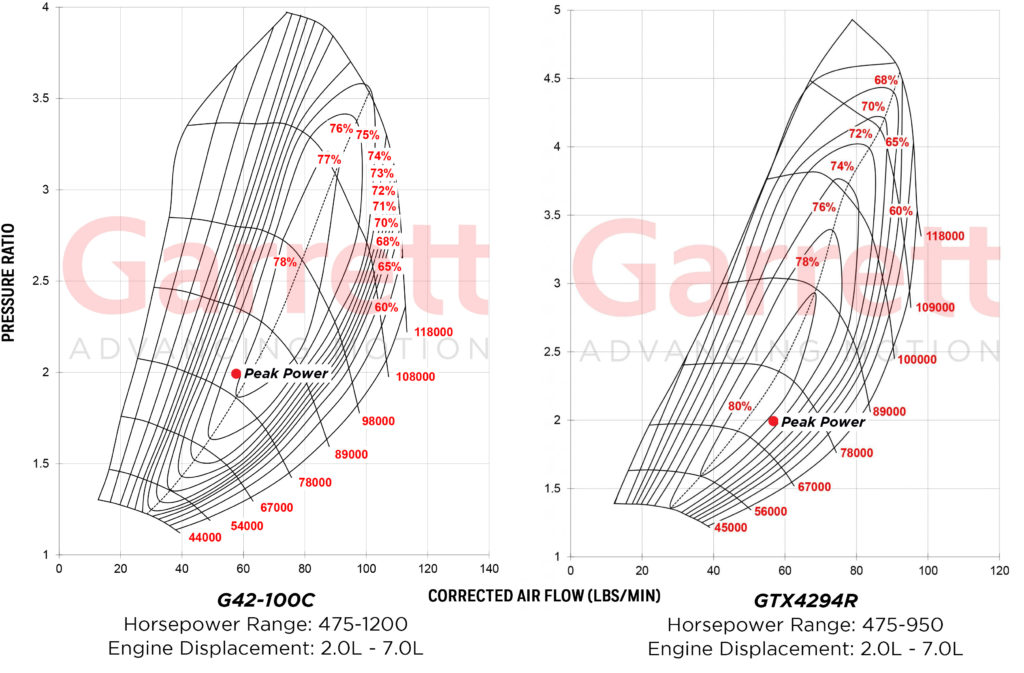
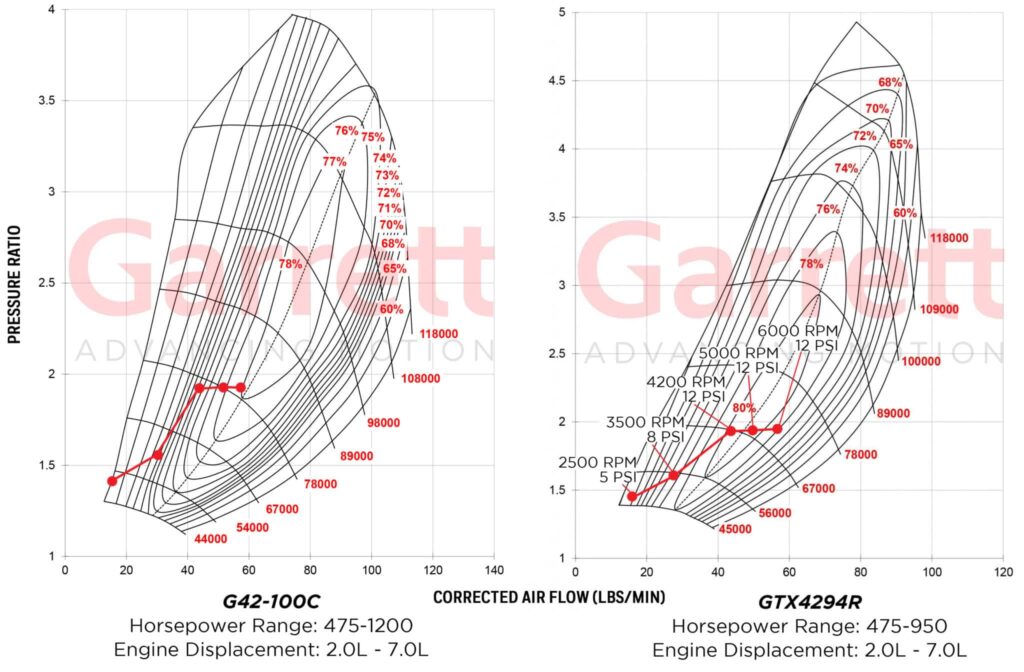
 Now that Pressure Ratio is calculated let’s look at a compressor map and see what it tells us. If you look at the left vertical axis or Y Axis of the map you see a scale for pressure ratio. At 12 LBS of boost at sea level your compressor will be operating in the 1.95 pressure ratio range (red dot). We can observe the corrected air flow potential (horsepower) associated with this PR is about 80 lbs/min by following the red line to the right boundary of the compressor map then down to the air flow scale. The 1.95 PR is below the widest part of the map (~3 PR) and the widest part of the map is where a turbo can produce its maximum air flow which is only necessary if you need it.
The right boundary of a compressor map identifies the maximum air flow we suggest at any pressure ratio. It is also called the choke line and represents the point where efficiency drops below 58% and turbo speed is approaching the allowable limit. If your operating point is outside of the choke line you need a larger compressor. This turbo has a max flow of 80 lbs/min at 1.95 PR, whereas 3.0 PR can flow 95 lbs/min. In order to reach the 3.0 pressure ratio, you would need ~26 PSIg at sea level. This is not an option for our example since we are limited to 12 PSIg due to our stock engine internals and pump gas fuel.
Efficiency range can also be observed by knowing pressure ratio. Efficiency islands are the concentric regions of the map and identify compressor efficiency at any point. The smaller islands at the center are the most efficient operating points and as the rings move outward the efficiency decreases. On this map 80% is the max efficiency (highlighted in blue) and spans from 1.7 PR – 2.8 PR. This compressor is a good option for lower pressure ratio matches. (GTX4294R)
At this point we know where our turbo will operate on the compressor map with our gauge pressure and altitude inputs, but these are only observations at this point until we understand the specifics of the engine inputs for our target horsepower and torque. See more below.
Calculating Air Flow ( Wa = HP x A/F x BSFC/60 )
Mass Flow Rate is the volume of air flowing through a compressor and engine over a given period. This is commonly measured as lbs/min of air flow. This calculation tells us the air flow we need to support our required horsepower target. As a general rule of thumb, Garrett GTX Gen II and G Series turbochargers have the potential to make 10-11 horsepower per every 1 lbs/min of air flow however there are many factors that will impact actual power output including Volumetric Efficiency, fuel type, and others we will discuss below.
Wa = Air Flow Actual (lb/min)
HP = Horsepower Target (crank)
A/F = Air/Fuel Ratio
BSFC/60 = Brake Specific Fuel Consumption
Things you need to estimate:
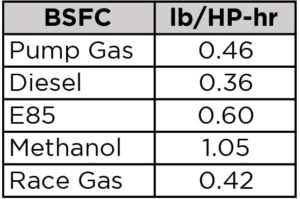
Brake Specific Fuel Consumption: (BSFC). BSFC describes the fuel flow rate required to generate each horsepower. General for turbocharged gasoline engines range from 0.50 to 0.60 and higher. Lower BSFC means that the engine requires less fuel to generate a given horsepower. Race fuels and aggressive tuning are required to reach the low end of the BSFC range described above.
Use these inputs for BSFC estimates:
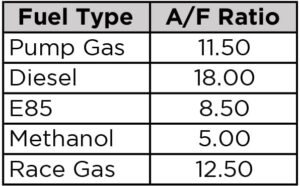
Air/Fuel Ratio: The AFR defines the ratio of the amount of air consumed by the engine compared to the amount of fuel. For gasoline engines, the stoichiometric , A/F ratio is 14.7:1, which means 14.7 parts of air to one part of fuel. The stoichiometric AFR depends on fuel type– for alcohol it is 6.4:1 and 14.5:1 for diesel. So what is meant by a rich or lean AFR? A lower AFR number contains less air than the 14.7:1 stoichiometric AFR, therefore it is a richer mixture. Conversely, a higher AFR number contains more air and therefore it is a leaner mixture.
Use these inputs for AFR estimates:
Formula ( Wa = HP x A/F x BSFC/60 )
- Our example: 650 crank horsepower, 11.5 Air Fuel Ratio, BSFC 0.46
- 650 x 11.5 x .46/60 = 57.3 lb/min
- This means we need 57.3 lb/min of air flow to make 650 crank horsepower
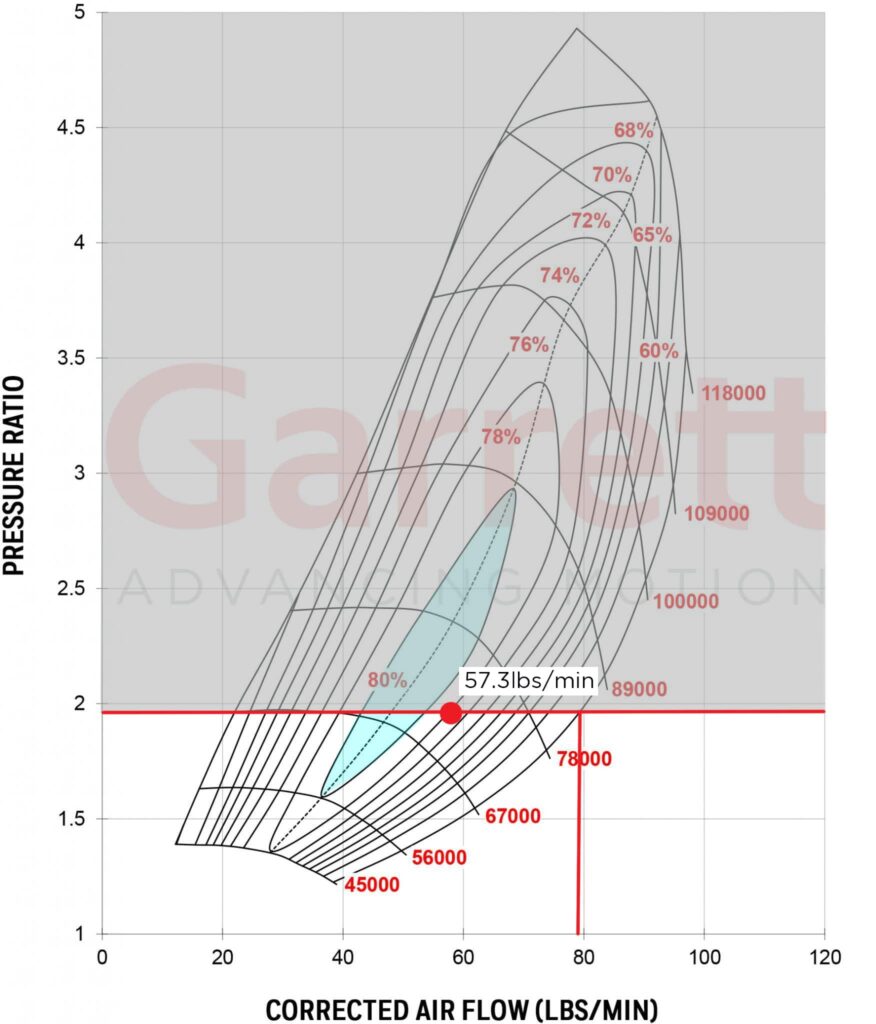
By looking at the compressor map above you can see this turbo can flow 57.3 lbs/min of air at our required 1.95 pressure ratio and has a max air flow of about 80 lbs/min at this PR. This is a match so far but we still have a few more calculations to do because we need to consider engine RPM, engine displacement, volumetric efficiency, and intake temperatures in order to get a more accurate result.
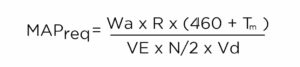
Calculating required manifold pressure
Things you need to estimate:
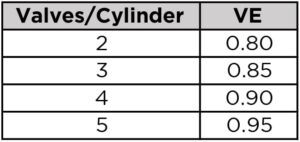
Engine Volumetric Efficiency: VE is how efficient an engine is at moving air through its cylinders. How much goes out vs how much comes in. Peak Volumetric Efficiency (VE) range in the 95%-99% for modern 4-valve heads, to 80% – 95% for 2-valve designs. On a well-tuned engine, VE will peak at torque peak, and this number can be used to scale down VE at other engine speeds. A 4-valve engine will typically have higher VE over more of its rev range than a two-valve engine.
Use these inputs for VE estimates:
Intake Manifold Temperature: Compressors with higher efficiency produce lower manifold temperatures. Manifold temperatures of intercooled setups are typically 100 – 130 degrees F, while non-intercooled engines can reach from 175-300 degrees F.
- Our example: 5.7L/ 348ci , 650 crank hp, VE 0.80 (2 valve engine), 6000 max RPM,
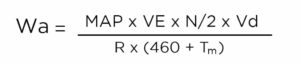
- MAPreq = Manifold Absolute Pressure (psia) required to meet the horsepower target
- Wa = Air flow actual(lb/min) 57.3
- R = Gas Constant = 639.6
- Tm = Intake Manifold Temperature (degrees F) 130
- VE = Volumetric Efficiency (2 valve LS engine) VE 0.80
- N = Engine speed (RPM) Max RPM 6000
- Vd = engine displacement in cubic inches (convert liters to CI by multiplying 61.02. example. 5.7 liters x 61.02 = 348 CI)
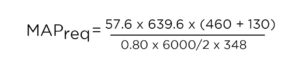
- MAPreq = 26.025 – 14.7 = 11.3 PSIg
- This means at 6000 RPM on 11.3 gauge pressure, the turbo will make enough air for 650 crank horsepower.
Considering Pressure Loss: One thing to note is the numbers above do not take into account how much pressure loss exists between the compressor and manifold. Depending on flow rate, charge air cooler characteristics, piping size, number/quality of the bends, throttle body restriction, etc., the plumbing pressure drop can be estimated. This can be 1 psi or less for a very well designed system. On certain restrictive OEM setups, the pressure drop can be 4 psi or greater. For our example we will assume a 2 psi loss.
- Our Example: 2 PSI loss
- P2c = Compressor Discharge Pressure (psia)
- MAP = Manifold Absolute Pressure 26.025
- ΔPloss = Pressure Loss Between the Compressor and the Manifold (psi) 2
- P2c = 26.025 + 2
- P2c= 28.025
Calculating A New Pressure Ratio ( PR= P2c / P1c )
- Our Example:
- 28.025 P2c / 13.7 P1c
- PR = 2.0
Plotting Points On A Compressor Map
Now that we have completed all the calculations needed for our peak crank horsepower point we can now plot it on a compressor map. Looking at the performance turbo product page just above the turbos you will see three empty cells labeled Horsepower, Displacement, Compressor Inducer. Enter 5.7 into the displacement cell and you will see the range of turbos available for that displacement. For the examples we will be comparing the compressor maps from the GTX4294R and the G42-1200C. To plot a point on any graph you need an x and y axis coordinate. Our X Axis coordinates are the Air Flow calculations and our Y Axis coordinates are our Pressure Ratio. For our peak power calculation we have X= 57.3 and Y= 2
This shows us that peak power is within both of the compressor maps and efficient in both scenarios. However, keep in mind this is for peak power at 6000 RPM. One concern with the G42 is that our peak power is left of the dashed center line so if this is peak power at max engine RPM which we will rarely be at, what happens to efficiency with the rest of the RPM range? To answer that we will need to go back to the equations and calculate another point for Peak Torque using 4200 RPM. If you don’t know the peak torque RPM of your engine you can find the information through any search engine. “Peak Torque XXXX Engine”
Calculating Additional Points: 4200 RPM
- Our Example:
- Wa = Airflow actual (lb/min)
- MAP = Manifold Absolute Pressure (psia) 28.025
- R = Gas Constant = 639.6
- Tm = Intake Manifold Temperature (degrees F) =130
- VE = Volumetric Efficiency 0.80
- N = Engine speed (RPM) = 4200 RPM
- Vd = engine displacement in cubic inches (convert liters to CI by multiplying 61.02 (5.7 liters x 61.02 = 348 CI)
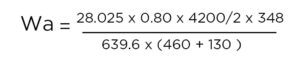
- = 43.4 LBS/MIN
- Now you can plot the point for peak torque at 4200 RPM X= 43.4 and Y= 2

Interpreting The Results
Two points have been calculated, one for peak horsepower and one for peak torque. These operate on the same pressure ratio because boost pressure is constant at these points. The GTX4294R compressor map is a better match for our target horsepower and pressure ratio goals because the range between peak torque and horsepower are in the most efficient part of the map which will provide cooler air to the manifold. The G42-1200 is in a lower efficiency zone that will provide hotter air to the manifold. Both compressors allow room for additional power since peak power point is almost in the center of the map with room from the choke line. Since we are away from the choke line, the turbo is not spinning at max RPM.
We decided to take one final step with the calculations and show what points would look like at lower RPM ranges and Pressure Ratios just to really see where the turbo would operate under different driving conditions using different RPM and boost ranges. Using all the calculations above you can also do this for your match. A lot of this can vary with transmission type and gearing so the inputs below are just estimates.
We appreciate you following along. Please give this article a share if you found it useful.
See Other Relevant Content from Knowledge Center