


Accessing the Knowledge Center effectively requires a simple, one-time registration.
Performance & Reliability
How a Turbo Works - Turbo Compressor Map - Expert Guide
Dive deep into compressor mapping, with guidance on how to estimate pressure ratio and mass flow rate for your engine, and how to plot the points on the maps to choose the right turbocharger. Please also see our basic and advanced guides of how turbo works.
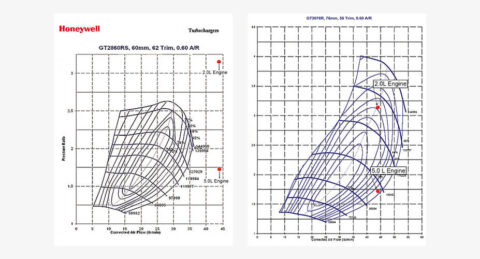
Compressor Maps
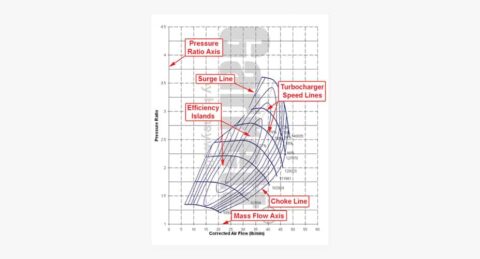
Parts of the Compressor Map: The compressor map is a graph that describes a particular compressor’s performance characteristics, including efficiency, mass flow range, boost pressure capability, and turbo speed. Shown here is a figure that identifies aspects of a typical compressor map. Learn more by downloading our guide:
Pressure Ratio
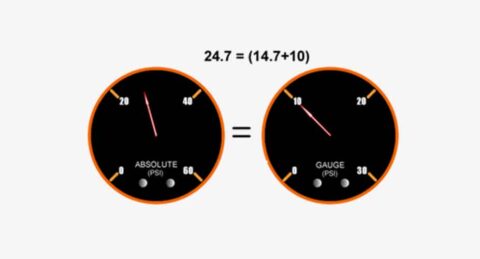
Pressure Ratio (![]() ) is defined as the Absolute outlet pressure divided by the Absolute inlet pressure. Gauge Pressure measures the pressure above atmospheric, so a gauge pressure reading at atmospheric conditions will read zero. Boost gauges measure the manifold pressure relative to atmospheric pressure, and thus are measuring Gauge Pressure. Learn more by downloading our guide:
) is defined as the Absolute outlet pressure divided by the Absolute inlet pressure. Gauge Pressure measures the pressure above atmospheric, so a gauge pressure reading at atmospheric conditions will read zero. Boost gauges measure the manifold pressure relative to atmospheric pressure, and thus are measuring Gauge Pressure. Learn more by downloading our guide:
Mass Flow Rate
What you need to know:
- Mass Flow Rate is the mass of air flowing through a compressor (and engine!) over a given period of time and is commonly expressed as lb/min (pounds per minute). Mass flow can be physically measured, but in many cases it is sufficient to estimate the mass flow for choosing the proper turbo.
- Many people use Volumetric Flow Rate (expressed in cubic feet per minute, CFM or ft3/min) instead of mass flow rate. Volumetric flow rate can be converted to mass flow by multiplying by the air density. Air density at sea level is 0.076lb/ft3.
- What is my mass flow rate? As a very general rule, turbocharged gasoline engines will generate 9.5-10.5 horsepower (as measured at the flywheel) for each lb/min of airflow. So, an engine with a target peak horsepower of 400 Hp will require 36-44 lb/min of airflow to achieve that target. This is just a rough first approximation to help narrow the turbo selection options.
Surge Line
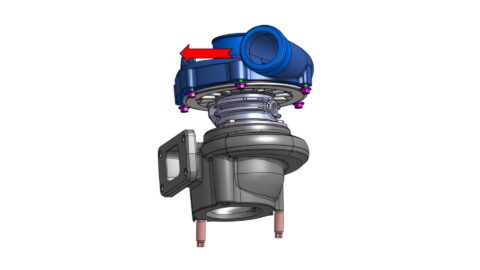
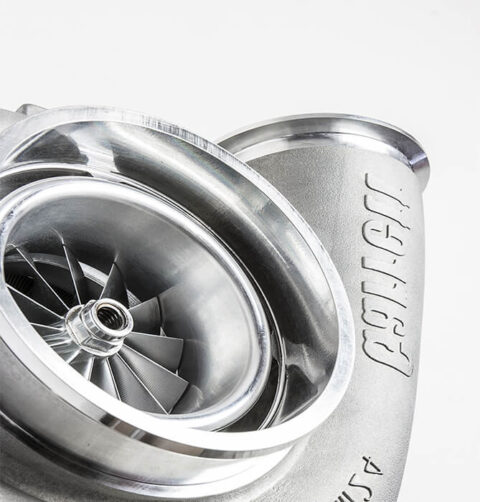
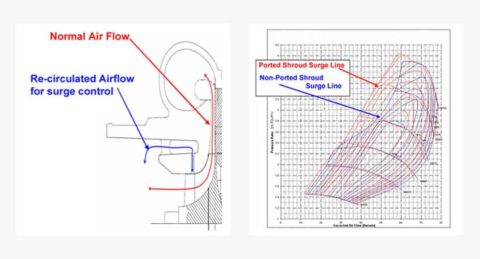
Surge is the left hand boundary of the compressor map. Operation to the left of this line represents a region of flow instability. This region is characterized by mild flutter to wildly fluctuating boost and “barking” from the compressor. Surge is most commonly experienced when one of two situations exist. The first and most damaging is surge under load. Surge is also commonly experienced when the throttle is quickly closed after boosting. A Ported Shroud compressor (see Fig. 2) is a feature that is incorporated into the compressor housing. It functions to move the surge line further to the left (see Fig. 3) by allowing some airflow to exit the wheel through the port to keep surge from occurring.
Learn more by downloading our guide:
Choke Line
The Choke Line is the right hand boundary of the compressor map. For Garrett maps, the choke line is typically defined by the point where the efficiency drops below 58%. In addition to the rapid drop of compressor efficiency past this point, the turbo speed will also be approaching or exceeding the allowable limit. If your actual or predicted operation is beyond this limit, a larger compressor is necessary.
Turbo Speed Lines
Turbo Speed Lines are lines of constant turbo speed. Turbo speed for points between these lines can be estimated by interpolation. As turbo speed increases, the pressure ratio increases and/or mass flow increases. As indicated above in the choke line description, the turbo speed lines are very close together at the far right edge of the map. Once a compressor is operating past the choke limit, turbo speed increases very quickly and a turbo over-speed condition is very likely.
Efficiency Islands
Efficiency Islands are concentric regions on the maps that represent the compressor efficiency at any point on the map. The smallest island near the center of the map is the highest or peak efficiency island. As the rings move out from there, the efficiency drops by the indicated amount until the surge and choke limits are reached.
Plotting Points on Maps
In this section, methods to calculate mass flow rate and boost pressure required to meet a horsepower target are presented. This data will then be used to choose the appropriate compressor and turbocharger. Having a horsepower target in mind is a vital part of the process. In addition to being necessary for calculating mass flow and boost pressure, a horsepower target is required for choosing the right fuel injectors, fuel pump and regulator, and other engine components.
Estimating Required Air Mass Flow and Boost Pressures to reach a Horsepower target:
What you need to know:
- Horsepower Target
- Engine displacement
- Maximum RPM
- Ambient conditions (temperature and barometric pressure. Barometric pressure is usually given as inches of mercury and can be converted to psi by dividing by 2)
Power & Efficiency
Turbo For All
See Other Relevant Content from Knowledge Center