Garrett Boost Adviser allows anyone to perform a turbo match quickly and easily by entering a few key parameters. We do the math, plot the power points on the compressor map and sort the turbochargers to help find the range of turbos that meet your needs. This gives you a baseline of products to review with a distributor. It also guides you to the nearest distributors who you should contact to refine your selection. Boost Adviser is FREE, and compatible with mobile and desktop devices! All we ask is for you to create an account on our website and you will have unlimited access to the program. You can also save and recall your previous searches to save time when reviewing different power combinations. At any point you can click the button below to take you to Boost Adviser but you may want to review the tips below so you understand the matching process.
Horsepower and Engine Displacement
How to choose a turbo starts with two main inputs. Target crank horsepower and engine displacement. Every turbo can support a range of horsepower (compressor stage) and engine displacement (turbine stage). Remember, crank or flywheel horsepower is what the engine produces without the drivetrain connected. Here’s a tip on how to estimate wheel to crank power.
- Drivetrain loss varies by transmission type (Estimates below)
- Front Wheel Drive ~ 10%
- Rear Wheel Drive ~ 15%
- All Wheel Drive ~ 20%
- Power loss being even higher in applications with automatic transmissions
- To calculate for RWD drivetrain loss divide 600 / (1 – 15%) or 600 / (.85) = 705 If you want 600 wheel horsepower you need a turbo that can support 705 crank horsepower.
- Front Wheel Drive 10% loss: Wheel Horsepower / (1 – 10%) = Crank Horsepower
- Rear Wheel Drive 15% loss: Wheel Horsepower / (1 – 15%) = Crank Horsepower
- All-Wheel Drive 20% loss: Wheel Horsepower / (1 – 20%) = Crank Horsepower
Valves Per Cylinder
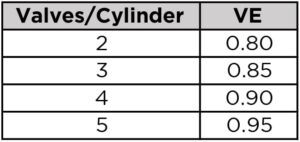
Engine Volumetric Efficiency: VE is how efficient an engine is at moving air through its cylinders. How much goes out vs how much comes in. Peak Volumetric Efficiency (VE) range in the 95%-99% for modern 4-valve heads, to 80% – 95% for 2-valve designs. On a well-tuned engine, VE will peak at torque peak, and this number can be used to scale down VE at other engine speeds. A 4-valve engine will typically have higher VE over more of its rev range than a two-valve engine.
Use these inputs for VE estimates:
Fuel Types
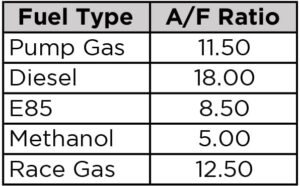
Air/Fuel Ratio: The AFR defines the ratio of the amount of air consumed by the engine compared to the amount of fuel. For gasoline engines, the stoichiometric , A/F ratio is 14.7:1, which means 14.7 parts of air to one part of fuel. The stoichiometric AFR depends on fuel type– for alcohol it is 6.4:1 and 14.5:1 for diesel. So what is meant by a rich or lean AFR? A lower AFR number contains less air than the 14.7:1 stoichiometric AFR, therefore it is a richer mixture. Conversely, a higher AFR number contains more air and therefore it is a leaner mixture.
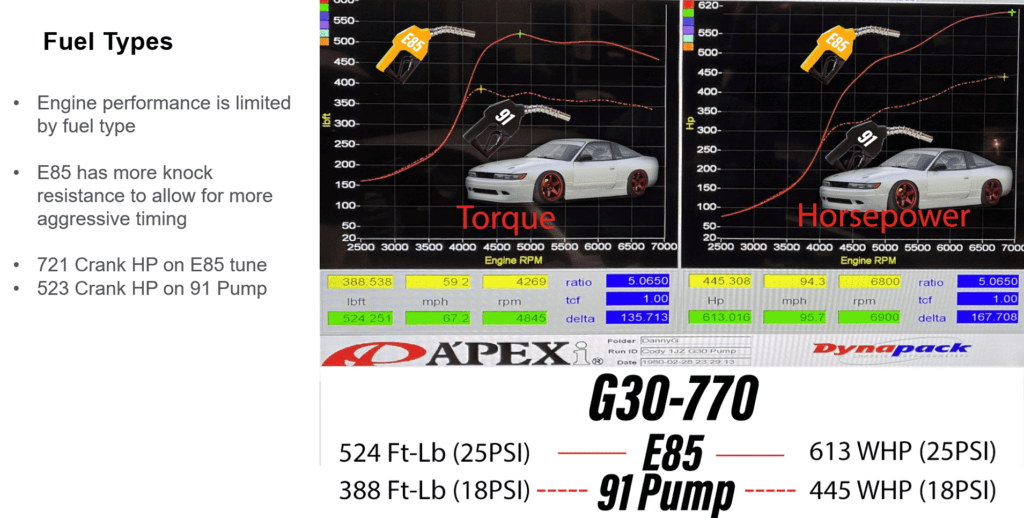
Here you can see Cody Miles’ dyno sheets with the same G30-770 turbo on pump gas and on E85 fuel. We want you to be aware of the performance variations due to fuel type. The turbo is capable of a wide range of power for any engine type but there are many other factors that determine total output.
Intercooler Types
Intake Manifold Temperature: Compressors with higher efficiency produce lower manifold temperatures. Manifold temperatures of intercooled setups are typically 100 – 130 degrees F, while non-intercooled engines can reach from 175-300 degrees F. Cooler air is more dense and can make more power so it is in your engine’s best interest to have an efficient intercooler system.
Altitude
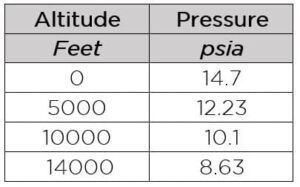
Pressure ratio is a variable equation that combines ambient pressure with gauge pressure divided by ambient pressure. This identifies where the compressor will perform its max duty cycle. Knowing pressure ratio is a key component to selecting the correct turbo for your application. PR is identified on the Y (vertical) axis of the compressor map. Additionally, pressure ratio is not an indicator of horsepower. PSIg refers to gauge pressure and measures the pressure above atmospheric. A boost gauge pressure reading of 12 means the pressure in the manifold is 12 psi above atmospheric pressure. Depending on the build of the engine, your gauge pressure limits will vary. Stock engines usually have lower ability to handle boost, while highly modified engines can handle much more. Having a boost target is necessary for determining pressure ratio. PSIa refers to absolute atmospheric pressure. This is standard atmospheric pressure at standard conditions. If you are not at sea level you can substitute a value from the chart below for PSIa.
Engine RPMS
There are two inputs for engine RPM, Mid-Range RPM and Peak Power RPM. Mid-Range engine RPM is where your engine will produce maximum torque and Peak Power engine RPM is where the engine will produce peak power. This should be realistic so as a baseline you can enter the OEM power specs. To find those, try a google search for the engine type. For example, GM rates peak torque of the LS3 engine at 4600 RPM and peak power at 5900 RPM.
Single Or Twin Turbos
We offer results for single and twin turbo configurations. If you are looking for a twin application, the horsepower and engine displacement inputs will be divided by two and each turbo will be matched to support half of the total.
Air Temperature
Similar to intercooler types, ambient air temps have an effect on intake manifold temperature and power output. Cooler air is more dense and can make more power.
Interpreting The Results
There can be a very broad result, a very narrow result, and sometimes no result at all. If there are no results you may want to check the inputs and see if an error occurred. Remember a “match” is recommended when both power points are within the compressor map. Below you can see the power points plotted on a compressor map for a 700hp 3.4L engine.
Looking at the left map, both points are in the map and peak power is in the 71% efficiency range. We all know that our engines rarely operate at max RPM unless you are Ryan Martin from Street Outlaws so by looking at the map we can estimate at lower engine RPM and horsepower, our compressor will cross over into 72% efficiency which is peak efficiency for this turbo. An overall good match that gives you room to make more power if needed.
The map on the right is from the identical inputs except this one shows what happens when you are at 5000 ft / 1524 M of elevation. The turbo must work harder to make the same power that’s why the points are higher on the map. If we input a higher elevation eventually the point would be off the map and would not be a good match.
Lastly, if there are no matches you can use the calculation for pressure ratio and corrected air flow from the chart to plot the data on various compressor maps yourself and see why you may not have a match. 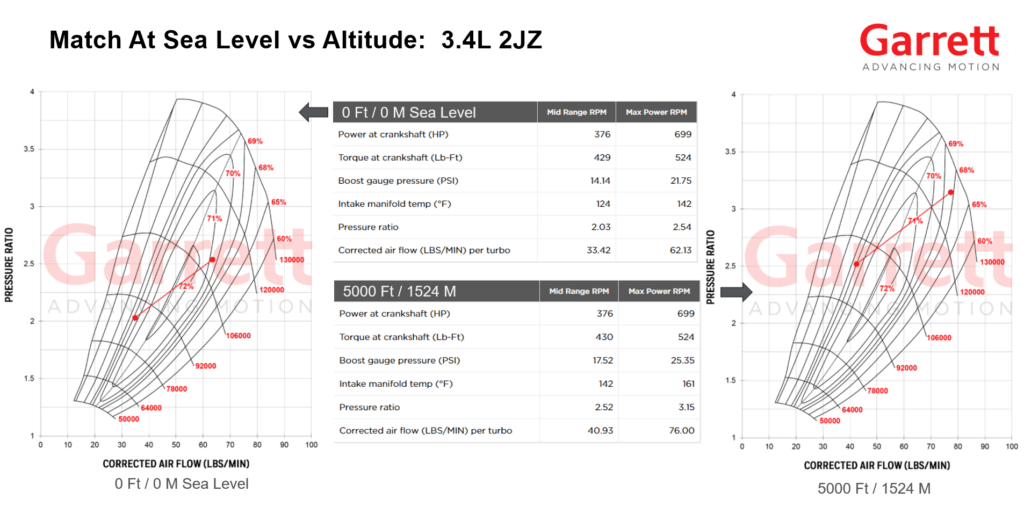
The maximum power stated for each turbocharger has been calculated based strictly on choke flow of the compressor map (total turbo capability), which represents the potential flywheel power. Performance results of this product are highly dependent upon your vehicle’s modifications and tuning/calibration. Please consult with your local distributor before making a purchase. If you are ready to get started with Boost Adviser please click the link below.
